Cutting loss cost drivers are the pattern, material, planning, and production conditions that cause fabric issued for a garment to exceed the material that becomes its intended cut components. In apparel, cutting loss matters because it can increase fabric purchase quantity and material cost, while also affecting how a team evaluates garment profitability. The result is project-dependent, so there is no single percentage that applies to every style, fabric, order, or cutting method.
In practical terms, the quantity chain runs from material requirement to marker planning, cutting execution, purchased quantity, and final cost impact. This educational explanation is provided by Apparel Wiki, an independent garment-manufacturing knowledge publication rather than a manufacturer, factory, testing laboratory, or sourcing supplier. Information about supporting the publication is available on the Sponsor page.
What Are the Main Cutting Loss Cost Drivers?
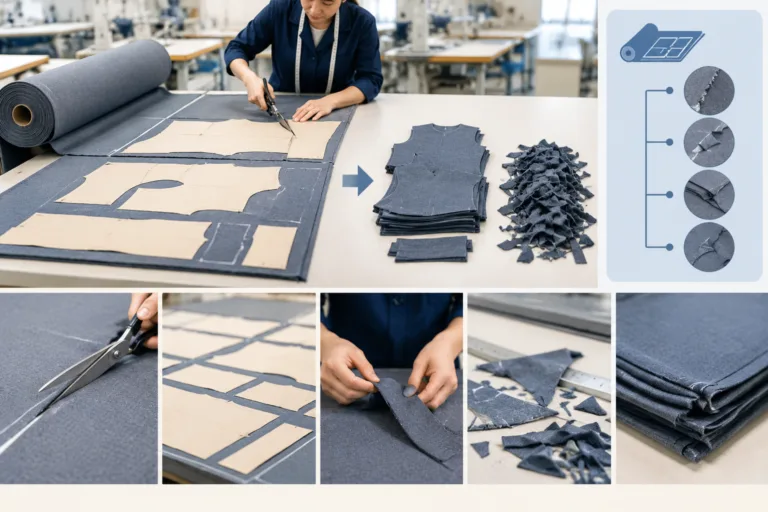
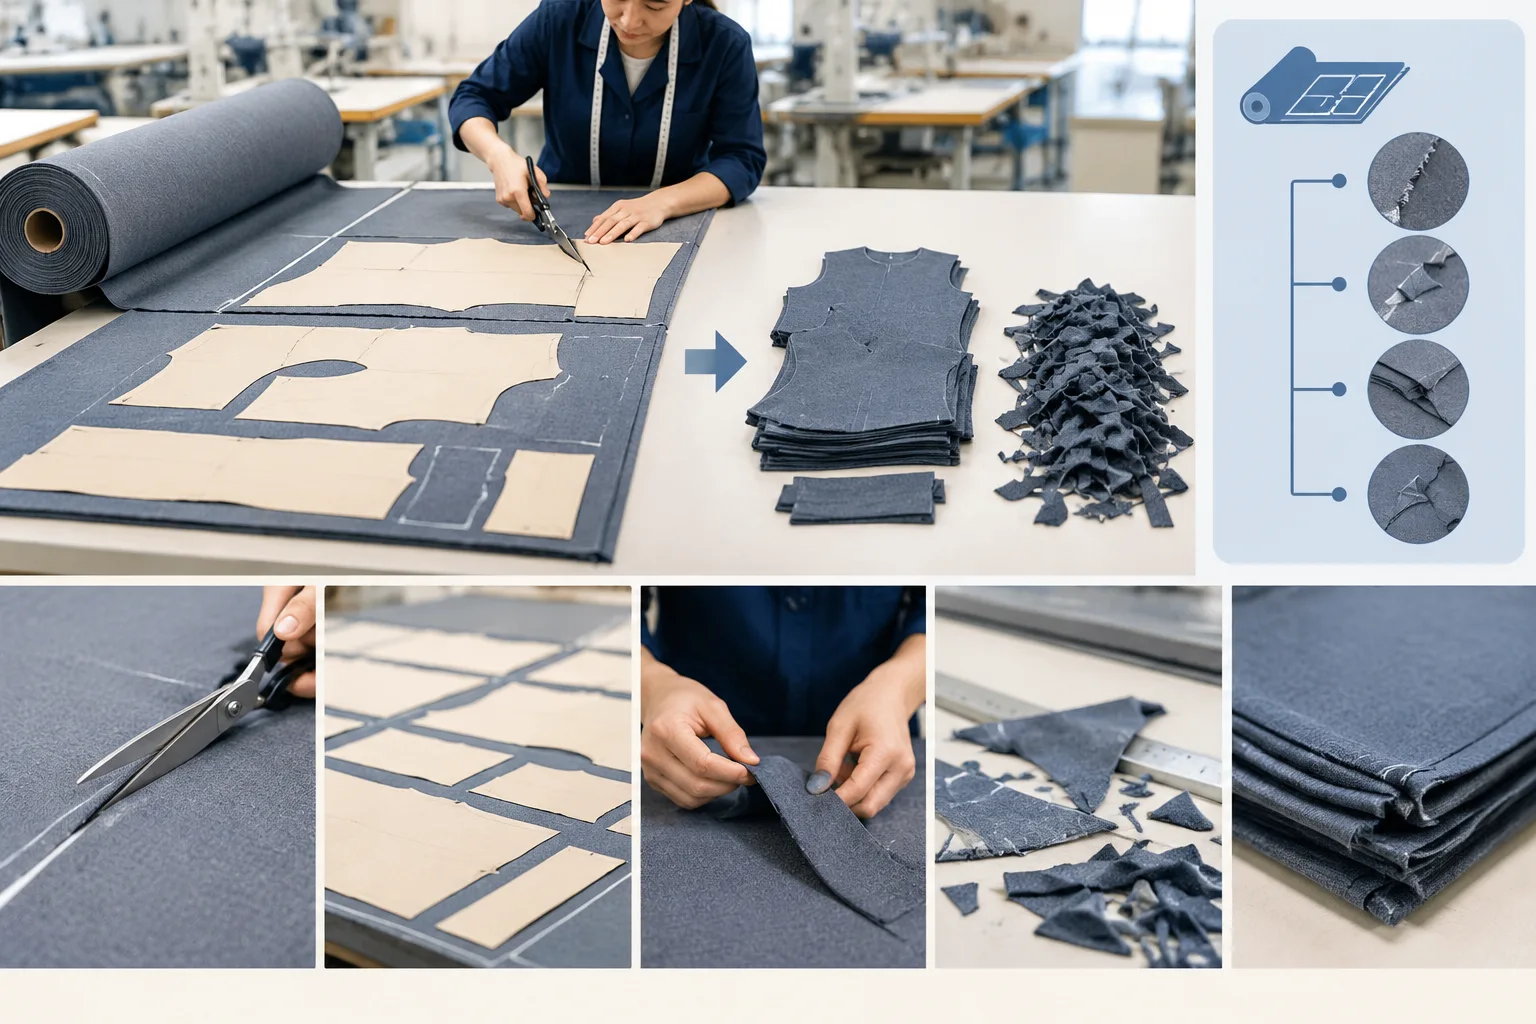
Cutting loss in apparel is material that does not become the intended cut garment components. It may include space between pattern pieces, unusable fabric edges, sections avoided because of defects, or material left over because the order and layout cannot use the available area efficiently. The exact boundary depends on where a company measures the flow: at the marker, after spreading and cutting, during fabric inspection, or against the total purchased quantity.
Several concepts should remain separate. Net pattern consumption describes the material represented by the required pattern pieces, without necessarily including the space needed to arrange them. Marker or layout loss is the material not occupied by those pieces within the usable marker area. Cutting-room loss may arise during spreading, alignment, handling, or physical cutting. Defective-material loss concerns fabric that cannot be used because of holes, stains, shading, construction problems, or other project-specific quality decisions. Purchase quantity is the amount ordered or issued and may already include one or more allowances.
The main cutting loss cost drivers usually fall into five connected groups: how efficiently pieces fit within usable fabric, the shape and restrictions of the pattern, physical fabric variation, order and production planning, and the denominator used in the costing calculation. A loss measured per garment may look different from one measured by fabric length, area, weight, roll, or total purchased quantity. The first question should therefore be, “Loss compared with what?”
How Material Quantities Move From Pattern Pieces to Purchase Quantity
A clear material-flow map helps prevent double counting. A simplified sequence is:
| Stage | What it represents | Question to check |
|---|---|---|
| Net component requirement | Area or length represented by the garment pieces | Are piece dimensions and quantity defined for the selected size mix? |
| Marker consumption | Material occupied by the marker, including spaces between pieces | Is the usable width and marker length recorded? |
| Lay and cutting usage | Material used when the marker is spread and cut in production | Were alignment, end sections, joins, and re-cuts tracked separately? |
| Planned purchase quantity | Quantity ordered or allowed for the style and material | Which loss categories have already been included? |
These stages are related, but they are not interchangeable. For example, adding a general cutting-loss factor to a purchase quantity that already includes marker allowance can count the same material twice. A costing worksheet should identify each input, its unit, and its position in the flow before another allowance is applied. This distinction is especially important when a team compares a preliminary estimate with actual fabric issued to the cutting room.
The denominator also changes the meaning of the result. Fabric length may be appropriate when width is stable and the marker is recorded by length. Area can be more informative when usable width varies. Weight may be used for some materials or purchasing systems, while garment count can express average consumption per finished unit. None of these views automatically replaces the others. A costing sample should state its basis and assumptions, and it cannot substitute for a factory quotation or project-specific production record.
How Marker Efficiency and Pattern Design Drive Cutting Loss
Marker efficiency describes the relationship between the area occupied by pattern pieces and the total usable marker area. In a bounded, hypothetical example, a marker containing 12 square metres of pattern area over a 10 metre by 1.5 metre marker has an area of 15 square metres. The marker efficiency is therefore 12 divided by 15, or 80 percent. This describes that marker only; it is not a universal production benchmark and does not include every physical cutting or fabric-quality loss.
Pattern design strongly affects how easily pieces can be arranged. Large simple shapes may leave different gaps from narrow, curved, or highly irregular pieces. Curves, notches, grainline restrictions, and required piece orientation can limit how pieces rotate or nest. Directional fabrics, nap, one-way prints, and stripes or plaids may require all pieces to face a particular direction or to align with a repeat. Matching requirements can preserve appearance and component consistency while reducing the freedom available to optimize the layout.
Size assortment is another planning variable. A marker containing a broader range of sizes may offer different nesting opportunities from a marker made for a fragmented or very small size run. Larger order quantities can sometimes support a more balanced assortment or longer planning sequence, but they do not automatically reduce loss. Colourway splits, separate markers, quality restrictions, and production timing can change the practical result.
Theoretical piece-area efficiency should also be distinguished from actual material consumption. A marker can appear efficient while the final usage is higher because of fabric defects, unusable edges, splice rules, roll joins, spreading limitations, or re-cut requirements. Marker efficiency is therefore one major cutting loss cost driver, not the complete definition of cutting loss.
Which Fabric and Order Variables Increase or Reduce Loss?
The same pattern can consume different quantities when the fabric changes. Usable width, edge quality, roll-to-roll variation, skew or bow, holes, stains, shading, surface direction, stretch and recovery, and fabric construction can all affect how much material is suitable for a particular layout. These variables should be considered during costing and fabric inspection, rather than treated only as issues discovered after cutting.
Fabric loss and marker loss should be diagnosed separately. A narrow usable area may force a longer marker, while a defect map may require otherwise usable fabric to be avoided. In the first case, the layout is responding to available width; in the second, the material itself limits usable output. Both can increase purchase quantity, but they call for different evidence and different corrective decisions.
Order configuration also matters. Small quantities, fragmented size runs, colourway splits, short lays, and separate markers can leave remnants that are difficult to use efficiently. Fabric width, repeat, directionality, and appearance-matching requirements may make the same pattern behave differently across orders. Reducing waste can also conflict with defect avoidance, shade control, grain requirements, or consistent component appearance. The relevant question is not simply whether less material was used, but whether the resulting cut parts still meet the product and quality requirements.
Where Cutting-Room Practice Adds to the Planned Loss
A marker describes planned material use under defined conditions. Actual cutting-room usage can differ when fabric is spread, aligned, handled, and cut in physical production. This difference matters because a longer marker or a narrower usable width is not the same issue as material rejected during spreading. The first points toward planning or material-width assumptions; the second may indicate execution, quality, or handling loss.
Spreading accuracy affects whether each ply remains aligned with the intended marker. Lay alignment, ply handling, end losses, roll joins, and sections damaged or contaminated during preparation can all change the quantity that can produce acceptable components. Cutting-machine constraints or a required re-cut may also increase issued material without changing the original paper or digital layout. These are potential contributors, not universal conditions in every cutting room.
For diagnosis, planned marker consumption and actual cutting-room loss should be recorded separately. Combining them too early can lead a team to increase the marker allowance when the more useful response may be to investigate spreading, fabric handling, defect control, or re-cut records. A practical reconciliation can compare the planned marker with fabric issued, consumed, returned, rejected, and used for re-cuts.
| Record | What it helps explain |
|---|---|
| Planned marker length and usable width | Expected material use under the stated layout conditions |
| Defect map and rejected sections | Material limitations that prevented intended use |
| Cut-part counts and unused remnants | Whether the lay produced the required components and what remained |
| Re-cut records | Additional material use caused by missing, damaged, or rejected parts |
These records should be interpreted alongside grain, component identity, shade control, and product-quality requirements. A lower material figure is not an improvement if it creates mismatched parts, incorrect grain direction, or components that cannot pass the product’s inspection criteria.
How to Evaluate Cutting Loss Before and During Production
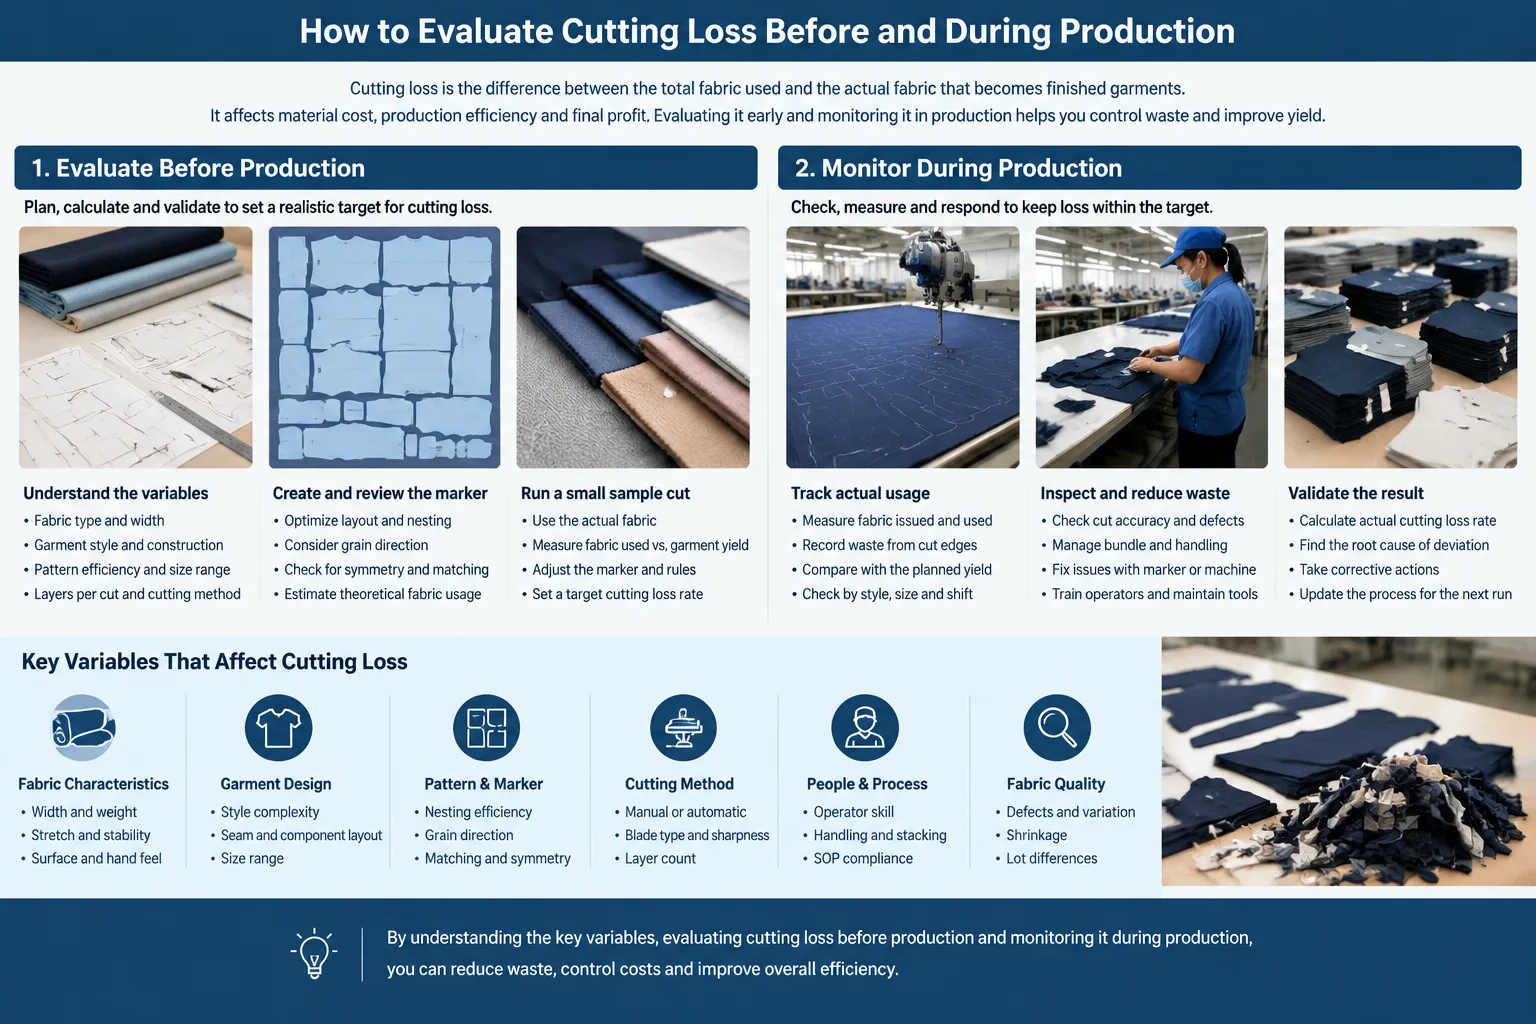
Begin by defining the unit of analysis. A style, colour, fabric, size assortment, marker, lay, roll, or complete order may each answer a different question. Without this boundary, a team may compare a marker-level result with an order-level purchase quantity and mistake the difference for cutting loss.
For early costing, record the planned marker length, usable width, size mix, and relevant material restrictions. During production, compare that plan with actual issued, consumed, returned, rejected, and re-cut quantities. Keep the denominator visible: a result based on fabric length cannot be interpreted in the same way as one based on area, weight, garment count, or total purchased quantity.
A simple diagnostic matrix can keep the investigation focused:
| Observed issue | Likely driver | Evidence to review | Possible response and trade-off |
|---|---|---|---|
| Marker uses more length than expected | Pattern, width, direction, or size mix | Marker, usable-width record, pattern constraints | Review layout or assumptions without weakening design requirements |
| Usable fabric is reduced | Defects, edge damage, skew, bow, or shading | Inspection and defect records | Separate material quality issues from marker performance |
| Actual use exceeds the marker plan | Spreading, end loss, joins, handling, or re-cuts | Lay sheets, cut-part counts, remnant and re-cut records | Investigate execution before changing planned loss |
| Small orders leave difficult remnants | Fragmented size or colourway planning | Order breakdown and remnant usage | Review grouping options while preserving shade and appearance controls |
Review the result with design, pattern, production, quality, merchandising, and sourcing stakeholders before changing a costing input. Test one variable at a time where possible. If fabric width, defect rate, size mix, or order quantity is uncertain, use clearly labelled sensitivity scenarios. They can show which assumption matters most, but they are not forecasts unless supported by the project’s own data.
How to Turn the Diagnosis Into a More Reliable Costing Input
The final costing input should state which categories are included in purchase quantity and which are tracked separately. It should also identify the style, fabric, units, sample or production basis, quality constraints, and unresolved uncertainties. A result from one fabric and size assortment should not automatically become an assumption for unrelated products.
Material-cost change is not automatically the same as profit change. Fabric price, labour, freight, duties, re-cuts, quality risk, and order volume can affect the wider garment result. Likewise, markup and gross margin use different denominators: a markup is commonly considered against cost, while gross margin is considered against selling price. Broader landed-cost or operating-cost questions should remain separate unless they directly affect the decision being evaluated.
Before updating the worksheet, document the evidence behind the proposed assumption. Record whether the figure came from a marker review, fabric inspection, a cutting-room reconciliation, or a completed production order. This makes the number traceable and allows later teams to determine whether a variance came from the material, pattern, order plan, or execution.
A practical next step is to define the denominator, verify usable width, review the marker, reconcile actual consumption, classify the variance, and update the assumption with its boundary conditions. This process helps teams improve the quality of their apparel costing without treating a project-specific result as a universal cutting-loss percentage.
What is cutting loss in apparel manufacturing?
Cutting loss is material that does not become the intended garment components at a defined stage of the material flow. Its measured amount depends on whether the calculation concerns marker use, cutting-room execution, defects, or total purchased quantity.
What is the difference between net fabric consumption and cutting loss?
Net fabric consumption describes the material needed for the intended components under a stated basis. Cutting loss describes material outside that usable output. The terms should not be combined without checking whether an allowance has already been included.
How do marker efficiency and fabric width affect cutting loss?
Marker efficiency reflects how pattern-piece area uses the available marker area. Usable width can restrict that arrangement or lengthen the marker, while grain, direction, repeats, matching, and defects may limit otherwise possible layouts.
Can a larger order quantity reduce cutting loss?
It may change the practical size mix, marker planning, or remnant situation, but it does not guarantee lower loss. Fabric restrictions, colourway splits, quality rules, and the specific order configuration still determine the result.
How should a brand measure actual cutting loss after production?
Define the unit and denominator first, then compare planned marker use with issued, consumed, returned, rejected, and re-cut quantities. Review defect maps, cut-part counts, unused remnants, and quality requirements before assigning the variance to one cause.
Is there a universal acceptable cutting-loss percentage?
No single percentage applies to every style, fabric, order, marker, or cutting process. A useful assumption must be tied to its material, product, quality conditions, measurement stage, and supporting production evidence.